Figure A: Shows the difference in deviations in absorbance when values are obtained at maximum wavelength of absorbance (band A) vs other wavelengths of absorbance (band B). Figure B: shows the deviations in Beer-Lambert law due to observations made at wavelengths other than lambda max.
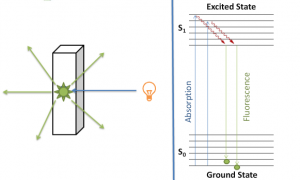
A diagrammatic representation of the hypothetical situation to derive the Beer-Lambert law containing a sample of path length b through which monochromatic light is passed.